
sendance-cloud
data tailored to the way you need it
Custom-made data visualization from product development to operation.


No need to develop your own front end


Our cloud is made for easy integration for speedy product development.
Work with our experts to go from optimal sensor placement to getting meaningful metrics.
Coming soon

Uniquely yours

We provide the data, you provide the brand
No need to push our brand to your end users. Our off-the-shelf branding gives customers access to their data in your environment.


Smart device, smart design
Create optimal sensor design from CAD-files
Upload your design and use our software to find the optimal sensor grid layout. Coming soon!

Manageable management
Stay in control of user access
Integrate the data from the sensors into your product platform. Manage organizations, users (or your users’ users) and devices from one central location with a solution that’s ISO-certified.


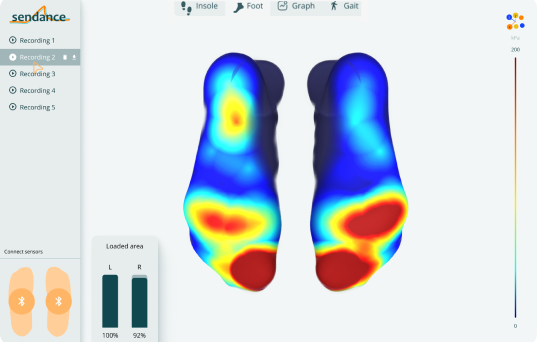
Information, in formation.
Visualize meaningful metrics
Optimal data visualizations to easily interpret information. Monitor users and devices remotely in real-time, or see the recordings later.


Specifications
Client
Record and analyze your sendance-grid data at up to 60 Hz with pre-built analyses like gait, graph and heatmap views in a web-app.
Grid Designer
Create your own custom sendance-grids: up to 64 sensors of different types (including pressure, temperature, etc.) at custom positions on your 3D-models, and directly adapt your device to accommodate all required grooves, electronics housings, and more. Coming soon.
Portals
Self-service your organizations, caregivers, patients, and devices in a separate management UI on the cloud.
Health Storage
Store your sensor, analysis and patient data in a certified secure and scalable cloud-native database system.
Services
Gain AI-powered insights on your devices with automated change recommendations to maximize their effectiveness. Coming soon.
Thickness
Access Health Storage and further services with a regular REST API and MQTT (coming soon).
Certification
ISO 13485, ISO 27001, ISO 27799, IEC62304, FDA and GDPR compliant.


You’re very close to your first sensor grid
Get started quickly. Get in touch to see when you can have your prototype in hand.
